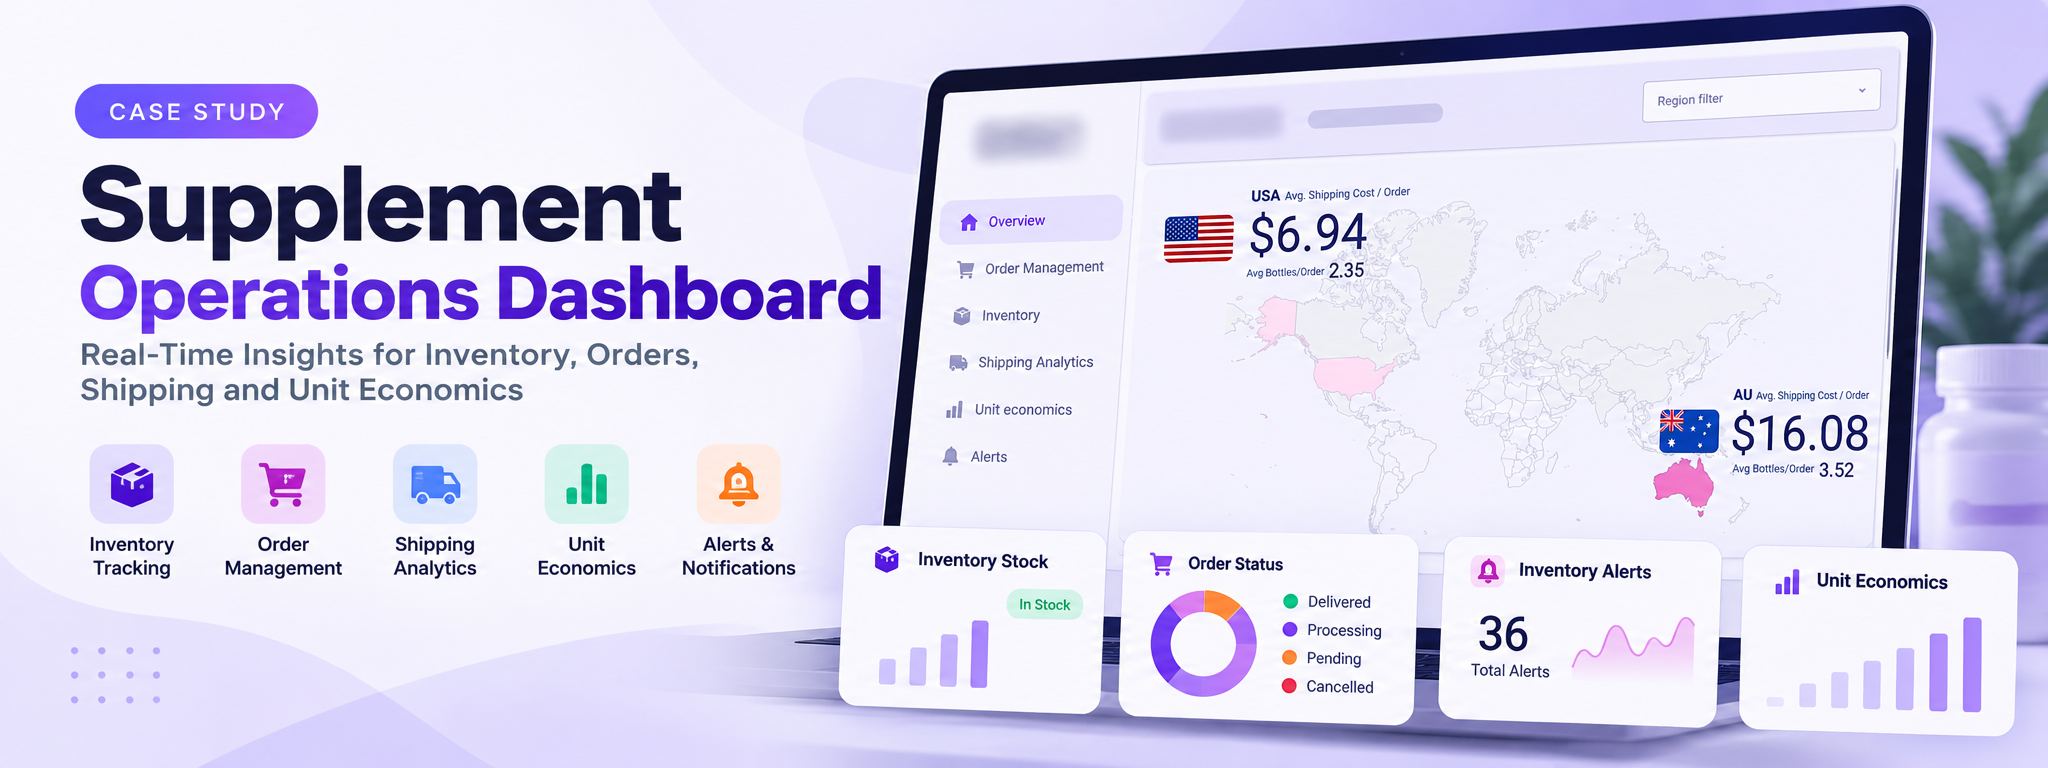
Supplement Operations Dashboard
A centralized analytics dashboard for monitoring orders, inventory levels, shipping performance, unit economics, and stock alerts.
 Looker Studio
- Looker Studio
- Slack
- Amazon
- Shopify
- Google Sheets
Overview
Managing supplement operations requires visibility into orders, inventory, shipping, product costs, and stock alerts. This project brings these areas together in an interactive Google Looker Studio dashboard, allowing users to review operational information, apply filters, and monitor different business activities from one interface.
The Problem
Operational information is often spread across separate reports and spreadsheets. Reviewing order statuses, checking stock availability, comparing regional shipping costs, and identifying inventory warnings can require repeated manual filtering and switching between data views.
A centralized dashboard was needed to organize these areas and make operational information easier to access, compare, and review.
How It Works
- Access the Dashboard: Users open the dashboard and navigate through the sidebar to the required operational section.
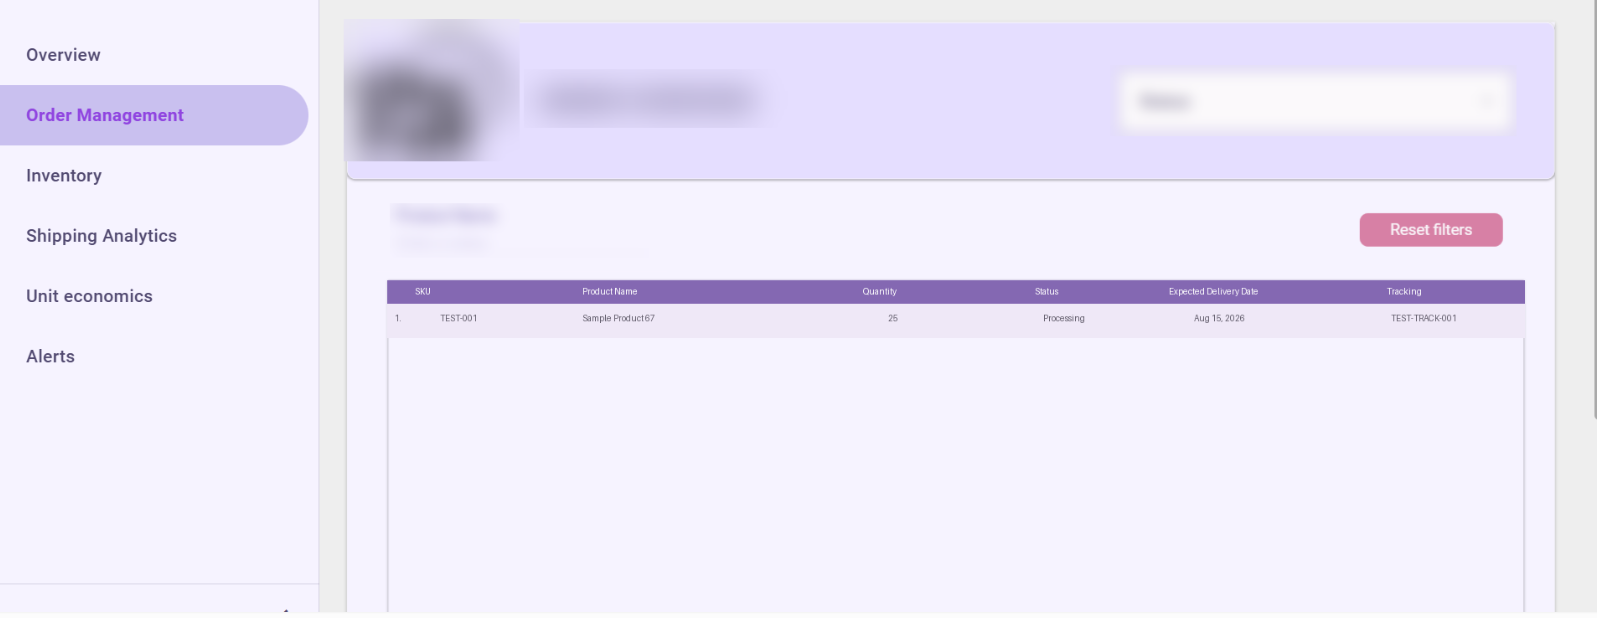
- Review Orders: The Order Management section displays product details, quantities, order statuses, expected delivery dates, and tracking information.
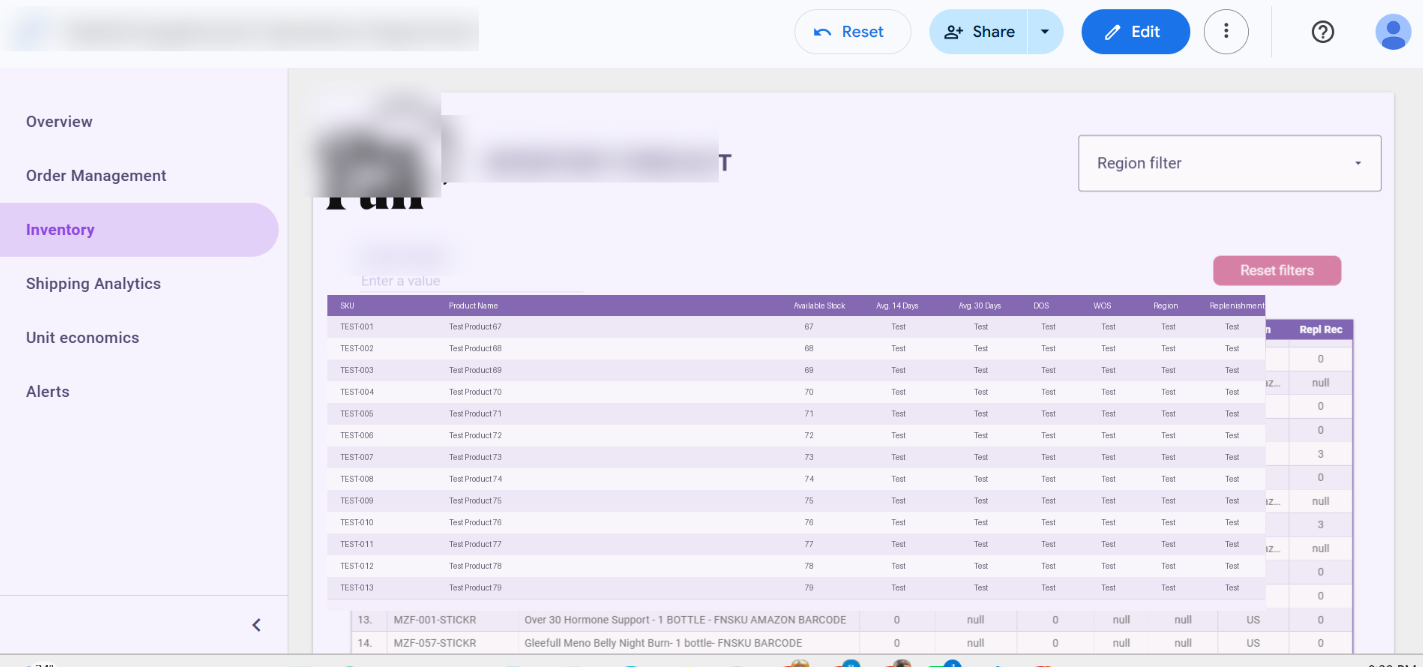
- Monitor Inventory: Users review available stock, days and weeks of supply, regions, and critical or warning indicators.
- Check Inventory Forecasts: The forecasting view presents current stock alongside average demand over 14 and 30 days and replenishment recommendation fields.
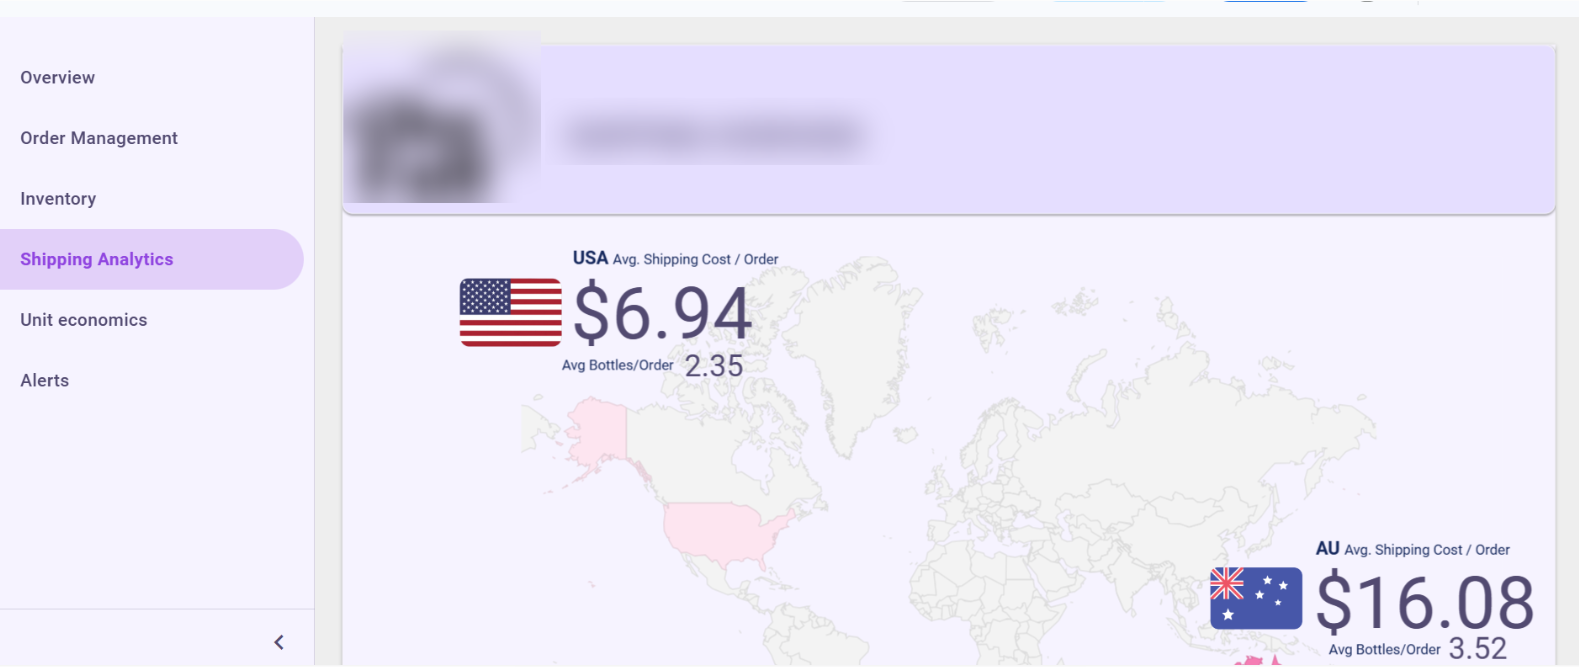
- Analyze Shipping: The Shipping Analytics section compares regional shipping costs and average bottles per order.
- Review Unit Economics: Users examine product prices, stock in hand, expiry dates, and cost of goods sold (COGS).
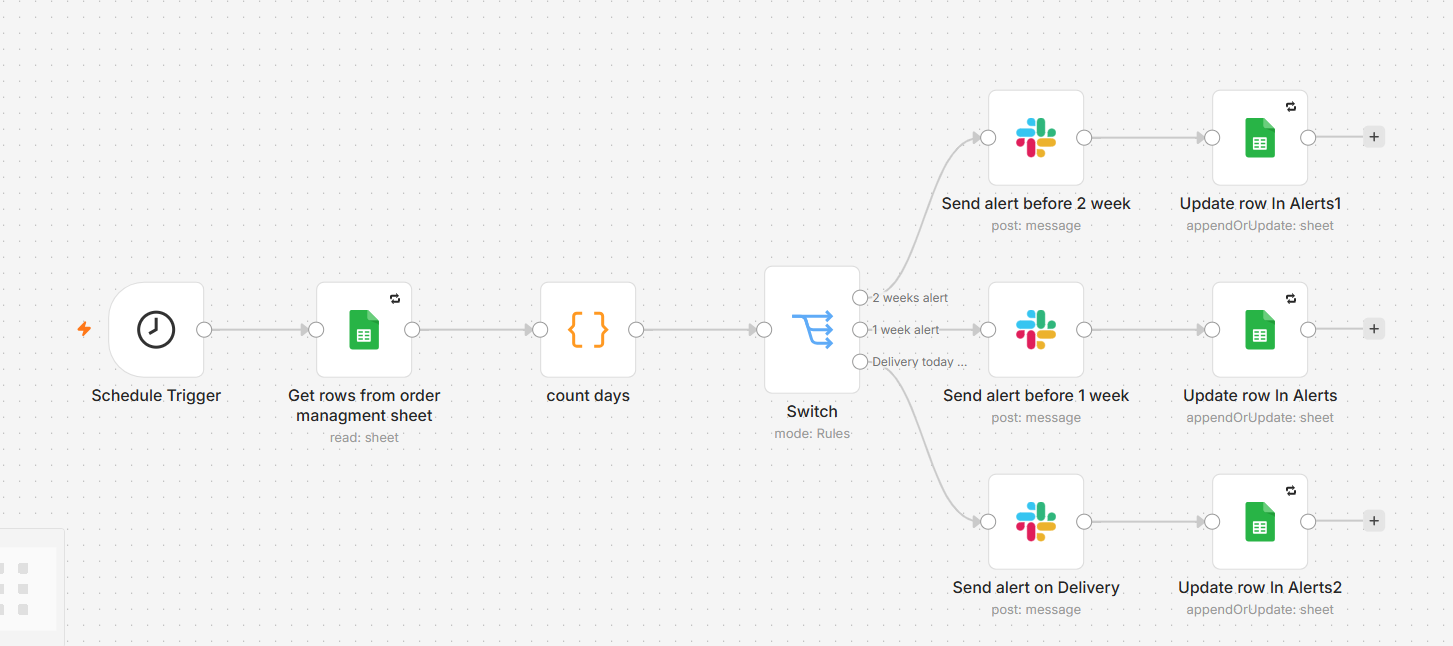
- Monitor Alerts: The Alerts section presents alert distribution and recent shipment-related notifications.
- Filter and Investigate: Available search fields, product filters, region selectors, and status filters help users narrow the information and identify records requiring attention.
Result
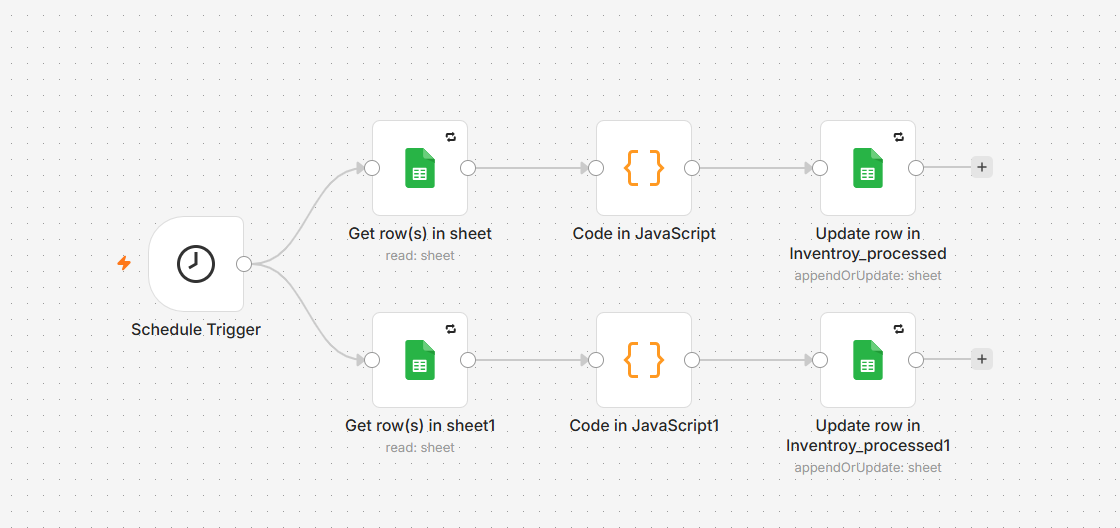
The dashboard provides a single interface for reviewing six operational areas: Overview, Order Management, Inventory, Shipping Analytics, Unit Economics, and Alerts.Users can move between dedicated reporting views, compare regional and product-level information, review inventory conditions, and identify shipment-related alerts without switching between separate reporting interfaces.
| Metric | Observed Output |
|---|---|
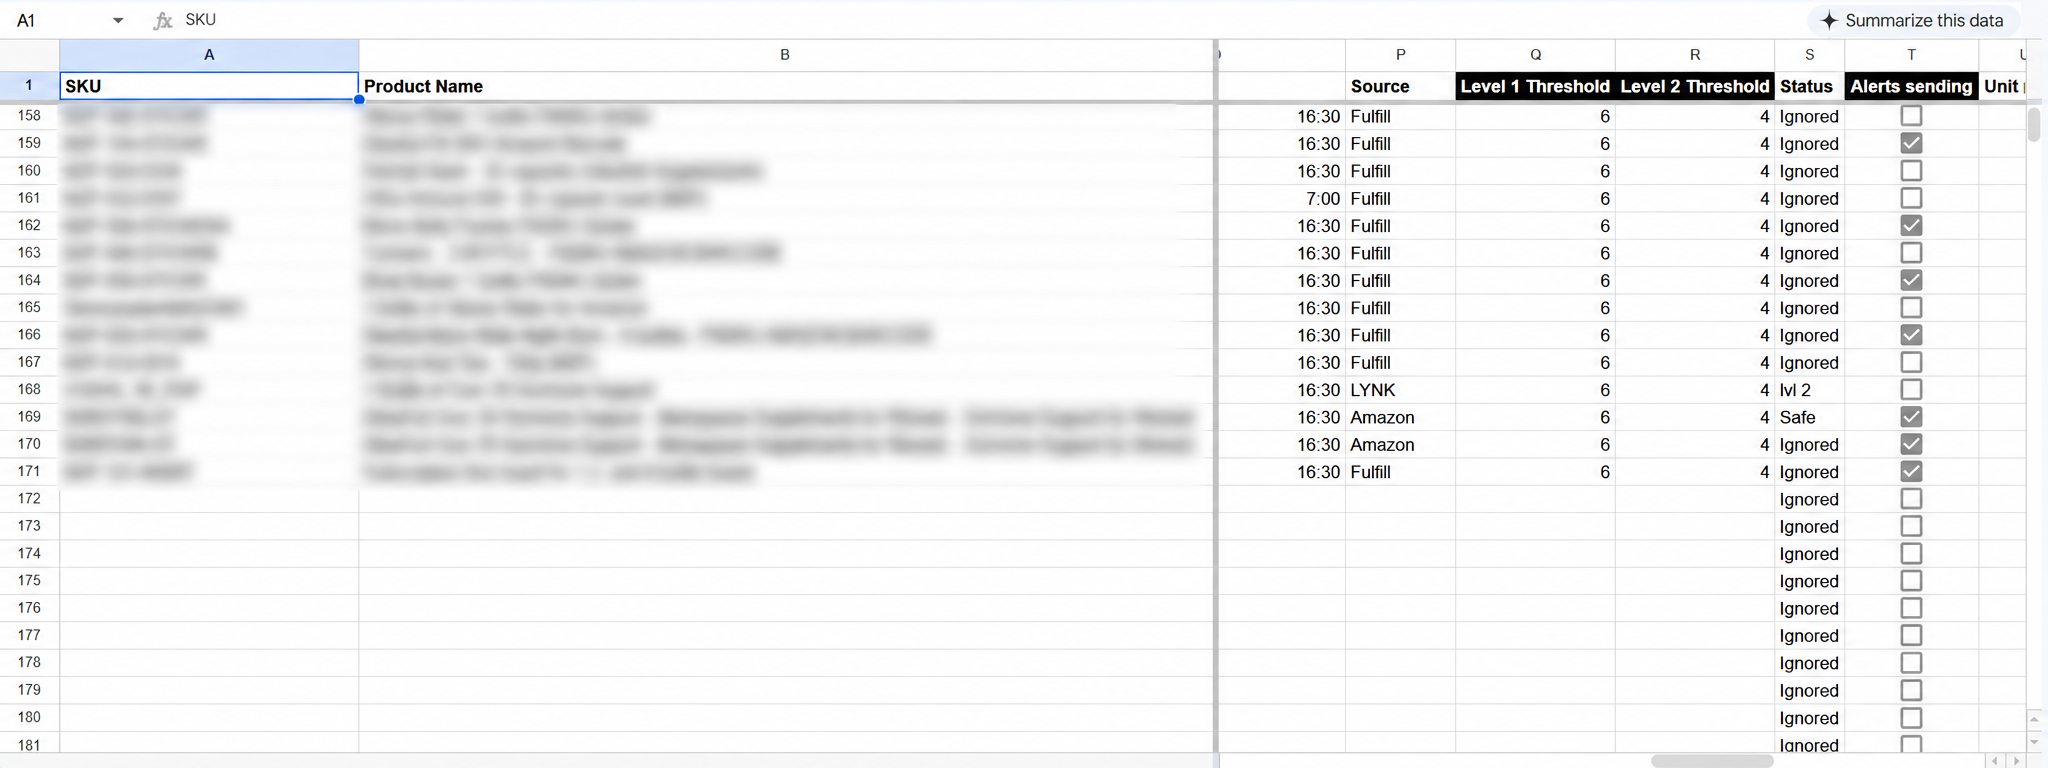
| Items tracked daily | 170 |
| Alert channels | 2 (Email + Slack) |
| Source platforms | 3 (Amazon, Shopify + Google Sheets) |
| Alert levels | 2 |
Tech Stack
Google Looker Studio: Dashboard interface, interactive filters, data tables, charts, and operational reporting.
Where This Pattern Applies
The same dashboard approach can be used by businesses that need to monitor several operational areas through one reporting interface.
- E-commerce: Track orders, inventory, shipping, and product performance.
- Retail: Monitor stock availability, replenishment needs, and sales operations.
- Warehousing: Review inventory levels, stock movements, and fulfillment activity.
- Logistics: Compare regional shipping costs and delivery performance.
- Manufacturing: Monitor material availability, product costs, and operational indicators.
- Distribution: Review order status, regional inventory, and shipment alerts.
The general pattern is to organize information from different operational areas into dedicated dashboard views, provide relevant filters and indicators, and make important records easier to review.