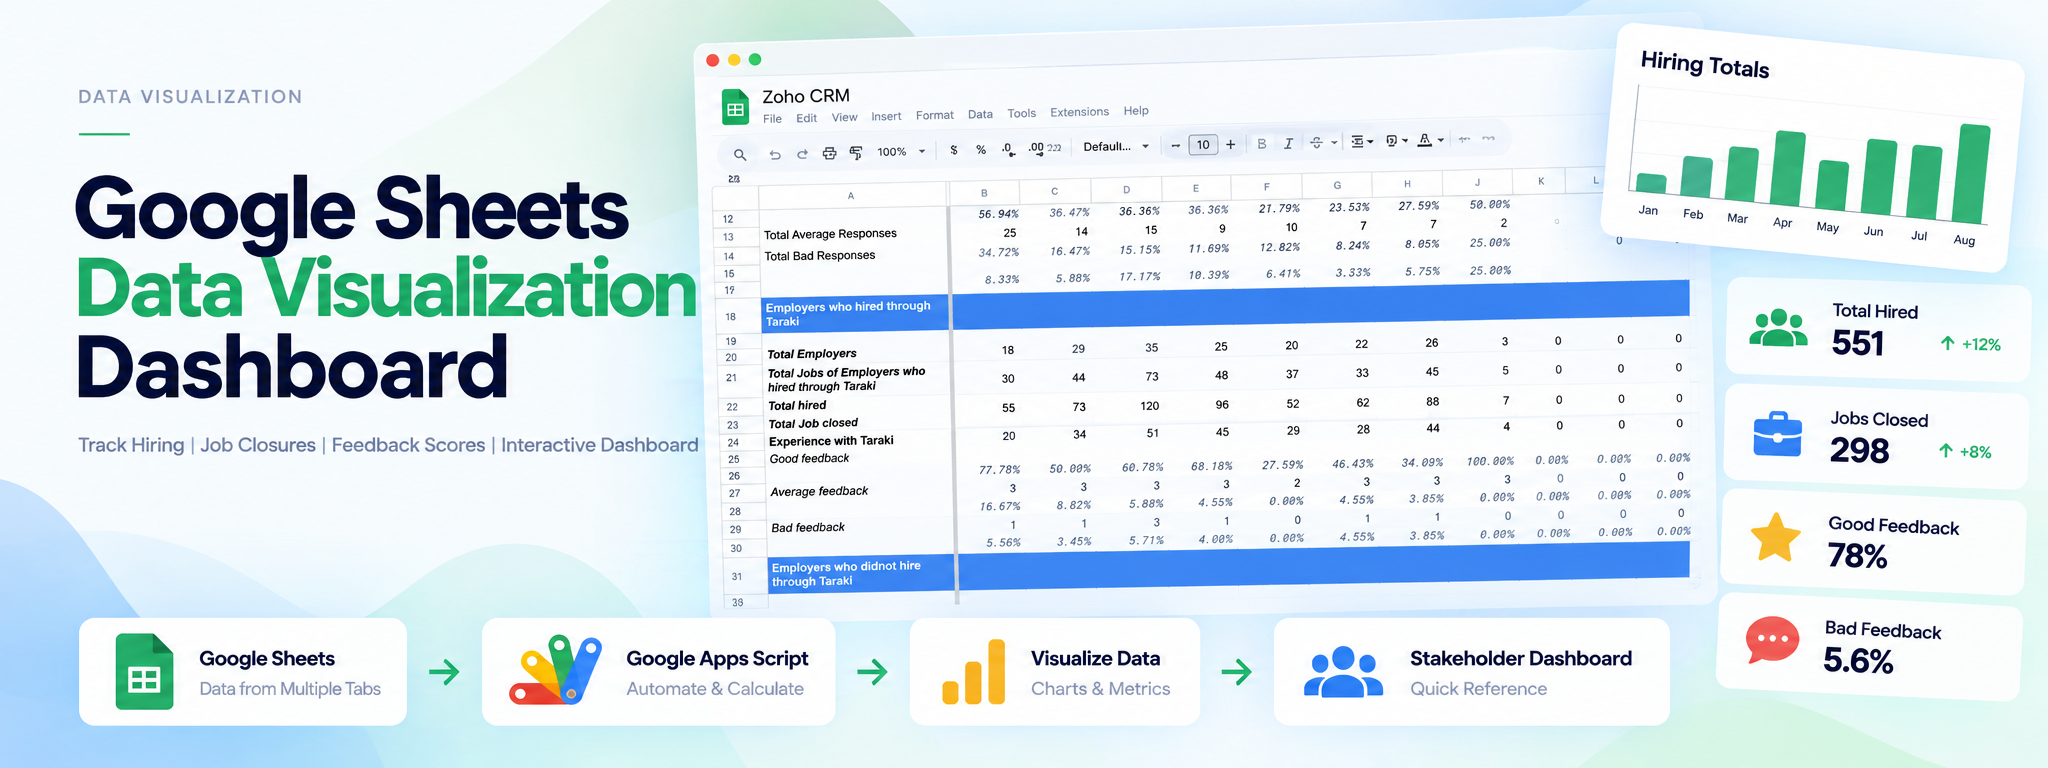
Google Sheets Data Visualization Dashboard
Created an interactive dashboard within Google Sheets for effective data visualization and tracking, serving as a quick reference tool for stakeholders.
 Google Apps Script
- Google Apps Script
- Google Sheets
Project Overview
This project uses Google Sheets to present CRM data in a dashboard format, giving stakeholders a quick reference for hiring totals, job closures, and feedback scores.
Technology: Google Sheets, Google Apps Script
01. The Solution
An interactive dashboard was created within Google Sheets to organize key metrics and make performance data easier to review.
02. Dashboard Metrics
- Total average responses
- Total bad responses
- Total employers who hired through Taraki
- Total jobs of employers who hired through Taraki
- Total hired
- Total jobs closed
- Experience with Taraki
- Good feedback
- Average feedback
- Bad feedback
03. Implementation
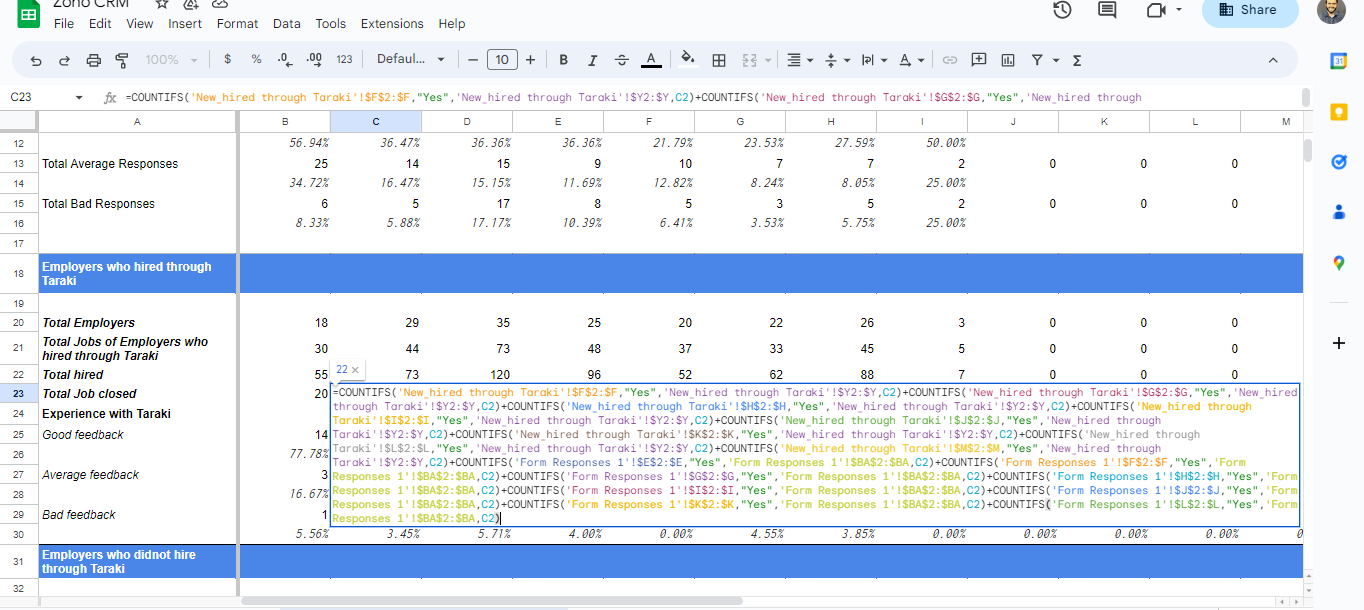
The dashboard uses Google Sheets formulas to calculate and display metrics from multiple data tabs, providing a consolidated view of hiring activity and feedback.
04. Outcome
The dashboard serves as a quick reference for stakeholders to track hiring activity, job closures, and feedback scores in one place.