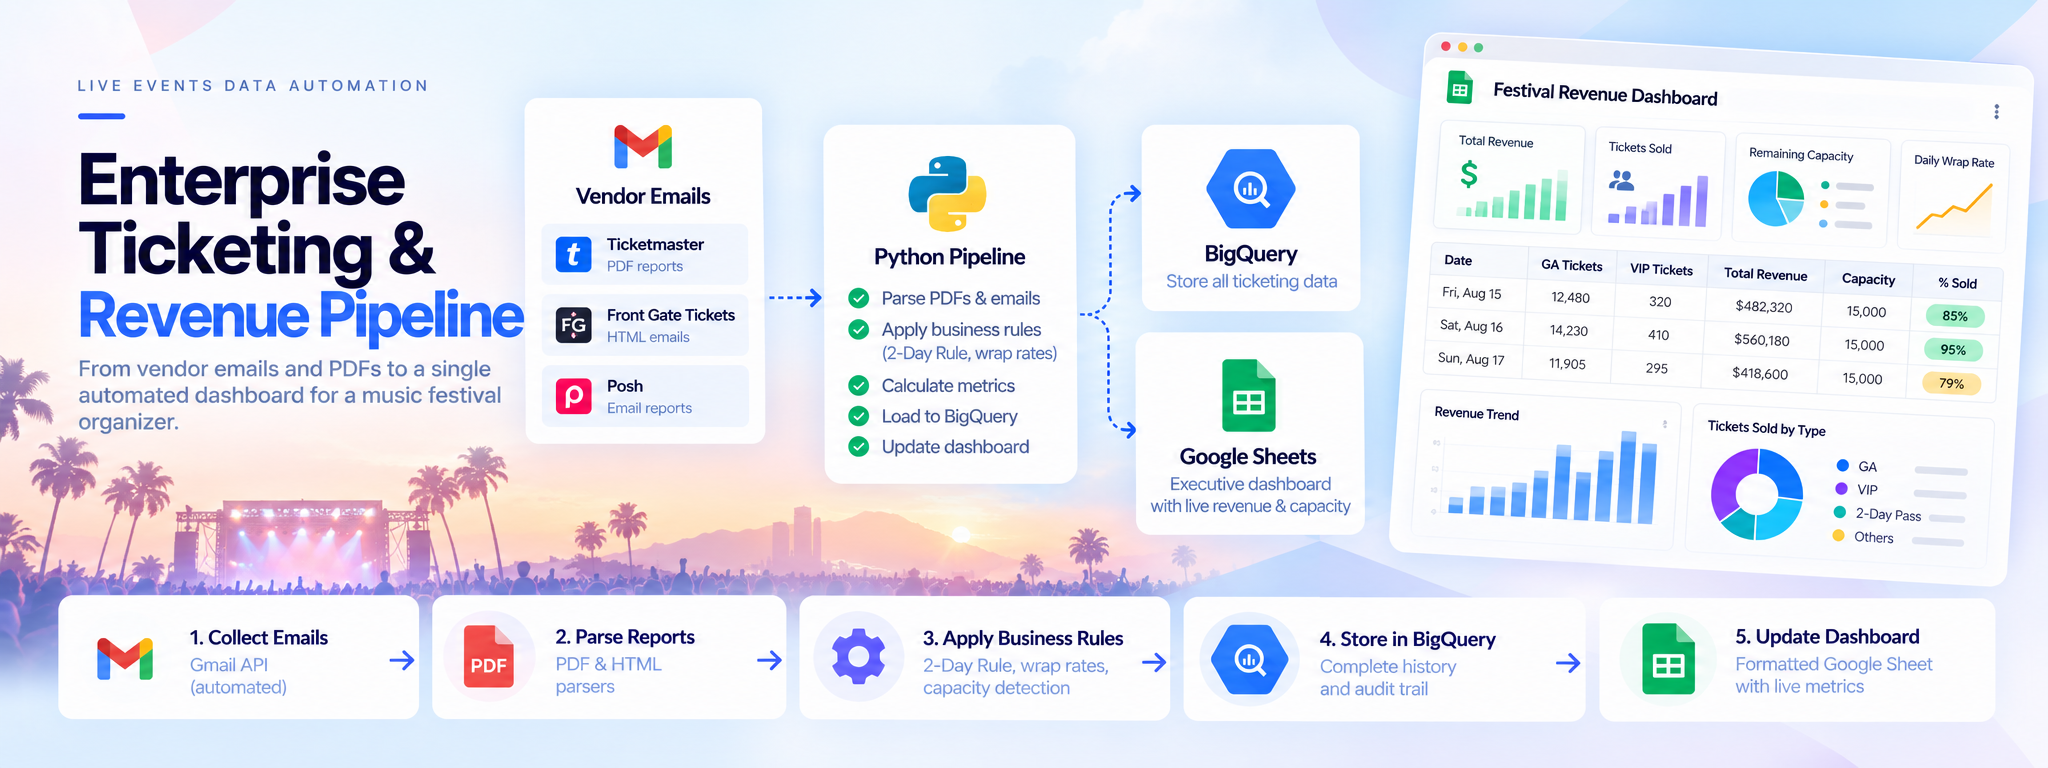
Enterprise Ticketing & Revenue Data Pipeline
An automated reporting system that collects ticket sales data from multiple vendors, calculates festival revenue and attendance, and updates a central dashboard using Python and Google Cloud.
 Python Automation
- Python
- Gmail
- BigQuery
- Google Sheets
Overview
Palm Tree Crew, a live music festival organizer, needed a reliable way to track ticket sales, revenue, and attendance across multiple festival locations. We developed a Python-based automation pipeline on Google Cloud that collects daily reports from Ticketmaster, Front Gate Tickets, and Posh through Gmail. The system processes the reports, applies the required business rules, stores the results in BigQuery, and updates a Google Sheets dashboard for the management team.
The Problem
The operations team had to download daily ticket reports from different vendors, extract the information from PDFs and emails, and manually enter the numbers into Google Sheets. They also had to calculate multi-day attendance and track revenue from separate VIP and sponsorship spreadsheets. This process took hours, increased the risk of errors, and made it difficult for management to view total revenue and remaining ticket capacity in one place.
How It Works
- Start the Automation: Google Cloud Scheduler triggers the Python service on Cloud Run at the scheduled reporting time.
- Collect Vendor Reports: The system uses the Gmail API to retrieve daily audit emails from Ticketmaster, Front Gate Tickets, and Posh.
- Extract Ticket Data: Custom Python parsers process Ticketmaster PDF reports and Front Gate HTML email tables to extract ticket sales information.
- Apply Business Rules: The system calculates daily attendance, 24-hour sales rates, and remaining capacity. It also splits two-day passes across the correct festival days.
- Store Data in BigQuery: Processed information is saved in three tables: raw reports, parsed report lines, and daily snapshots.
- Update the Dashboard: The Google Sheets API rebuilds the executive dashboard with ticket sales, revenue, attendance, sales rates, and remaining capacity.
- Include Offline Revenue: VIP table and sponsorship data from external spreadsheets is connected through Google Sheets IMPORTRANGE, bringing online and offline revenue into one view.
Result
The system brings ticket sales collection, revenue calculations, and reporting into one automated pipeline.
- Replaces hours of manual report collection and data entry with scheduled automation.
- Combines ticket sales data from multiple vendors in one dashboard.
- Reduces manual calculation errors and duplicate ticket counting.
- Provides a combined view of online ticket sales, VIP tables, and sponsorship revenue.
- Displays daily attendance, sales rates, and remaining ticket capacity.
- Allows new festival shows and ticketing platforms to be added through a standard onboarding template.
Tech Stack
- Python: Handles report extraction, data processing, and business calculations.
- Google Cloud Run: Hosts and runs the Python automation service.
- Google Cloud Scheduler: Triggers the pipeline at scheduled intervals.
- BigQuery: Stores original reports, parsed ticket data, and calculated daily snapshots.
- Gmail API: Retrieves daily ticketing reports from vendors.
- Google Sheets API: Builds and updates the executive dashboard.
- IMPORTRANGE: Connects external VIP table and sponsorship revenue spreadsheets.
Where This Pattern Applies
The same approach can help organizations that collect operational and financial data from multiple external sources.
- Event Organizers: Combine ticket sales and attendance data across different events.
- Music Festivals: Track revenue, ticket sales, and venue capacity across multiple locations.
- Ticketing Companies: Process reports from different ticketing platforms.
- Hospitality Businesses: Combine revenue and booking data from multiple systems.
- Finance Teams: Automate daily reporting and bring information from separate spreadsheets into one dashboard.
The general approach is to collect reports from different sources, extract and process the data, apply business rules, and deliver updated results through a centralized dashboard.