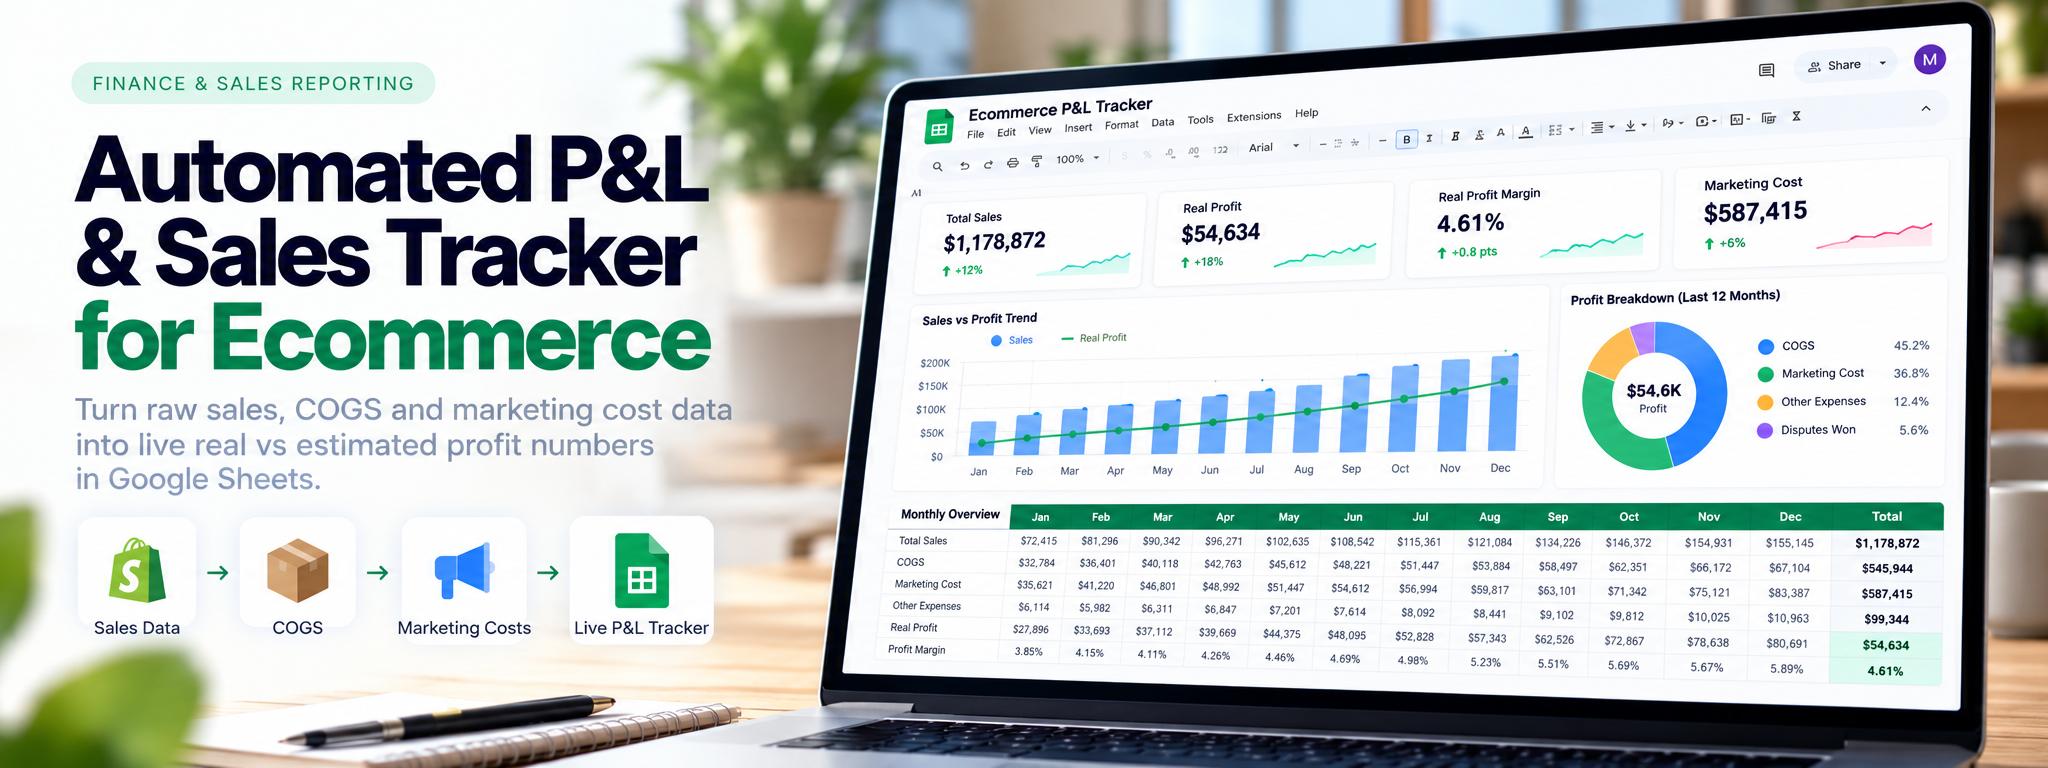
Automated P&L & Sales Tracker for Ecommerce (Google Sheets)
A single Google Sheets template that turns raw sales, COGS and marketing cost data into live real-vs-estimated profit numbers for any date range.
- Google Sheets
Project Overview
This project delivers an automated profit and loss (P&L) tracking solution for an ecommerce business. It consolidates sales, real COGS, marketing costs, and other expenses into a single spreadsheet-based reporting system.
The tracker calculates real and estimated profit automatically, allowing the team to review financial performance across different date ranges without rebuilding reports manually.
The Challenge
Ecommerce financial data can be spread across sales records, product costs, marketing expenses, and other operational costs. Combining these figures manually makes it harder to maintain an up-to-date view of profitability.
The main challenges included:
- Fragmented financial data: Sales, COGS, marketing spend, and other expenses needed to be considered together.
- Manual reporting: Profit and loss figures required repetitive calculations and reporting work.
- Limited visibility: Understanding real profit, estimated profit, and profit margins across different periods required a consolidated view.
- Date-range comparisons: Reviewing daily, monthly, and longer-term performance required flexible reporting.
The Solution
A reusable Google Sheets template was developed to bring the relevant financial figures into one reporting system and calculate profitability automatically.
The solution provides:
- Automated P&L calculations: Combines sales, COGS, marketing costs, and other expenses to calculate profit metrics.
- Real vs. estimated profit: Makes both measures available for financial review.
- Flexible date-range reporting: Allows the team to review performance for selected periods.
- Daily performance tracking: Presents sales, profit, and expense metrics for day-to-day monitoring.
- Monthly and rolling analysis: Supports longer-term performance reviews and expense breakdowns.
- Reusable template: The same template can be applied to different brands, with totals recalculated for the relevant data.
Key Dashboard Features
Finance & Sales Reporting
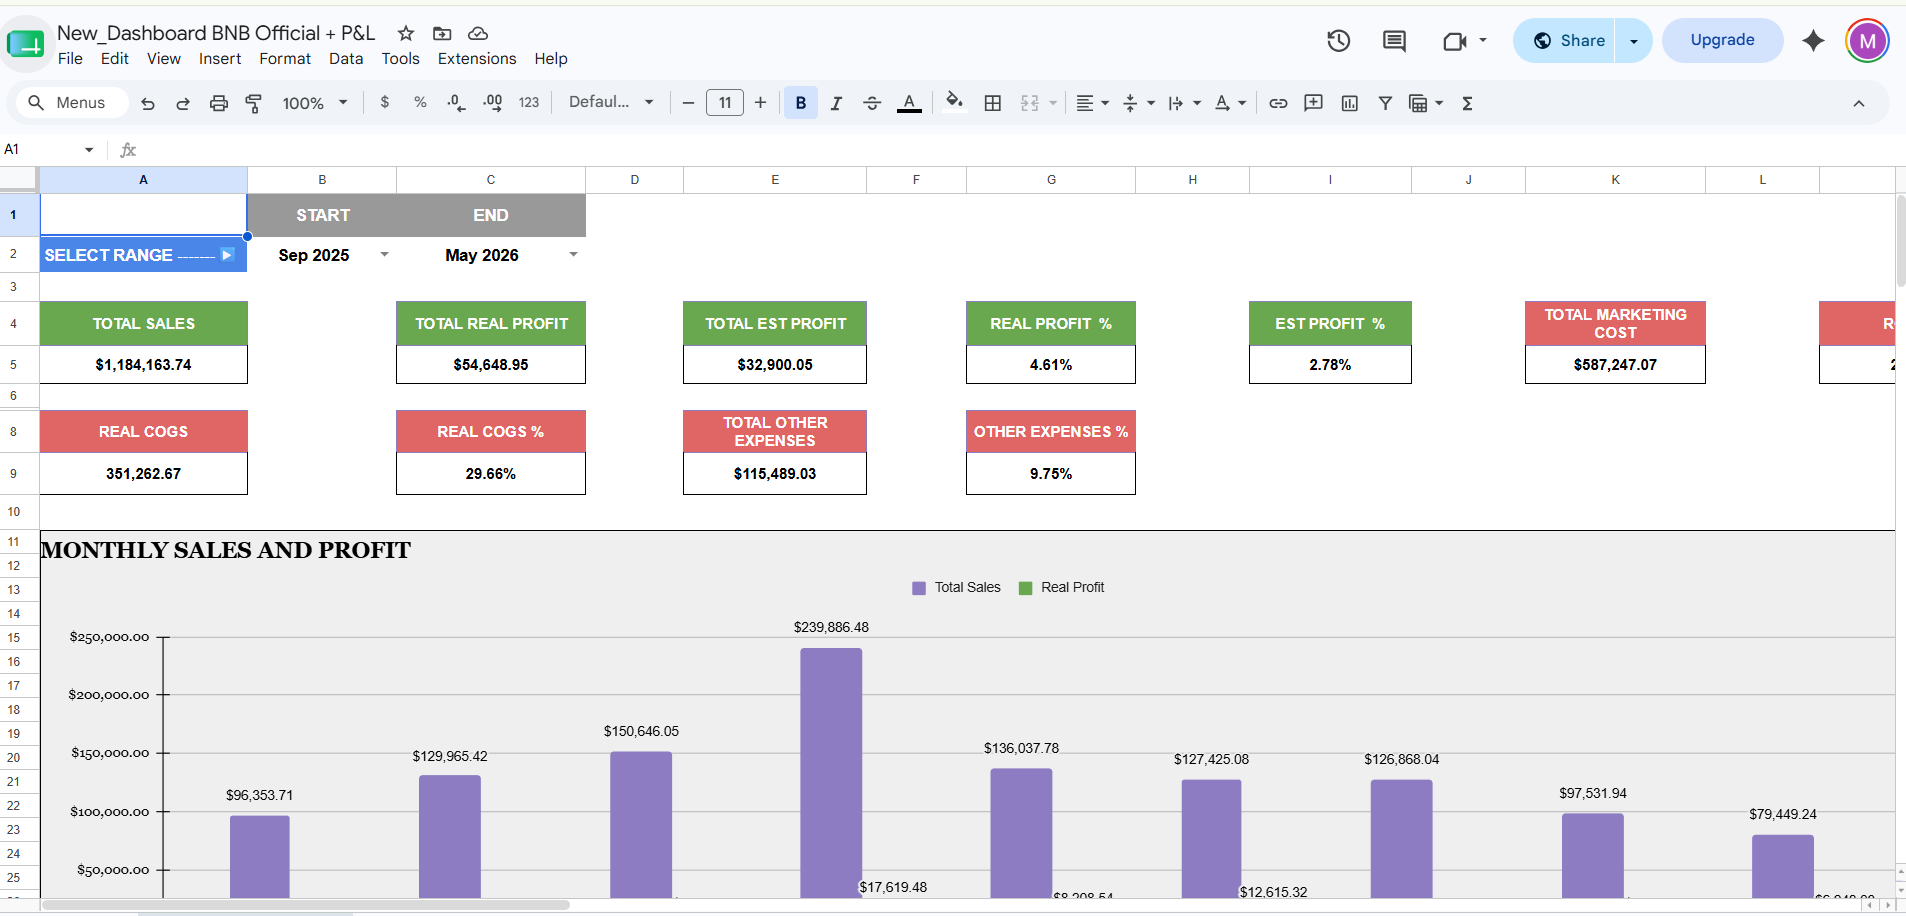
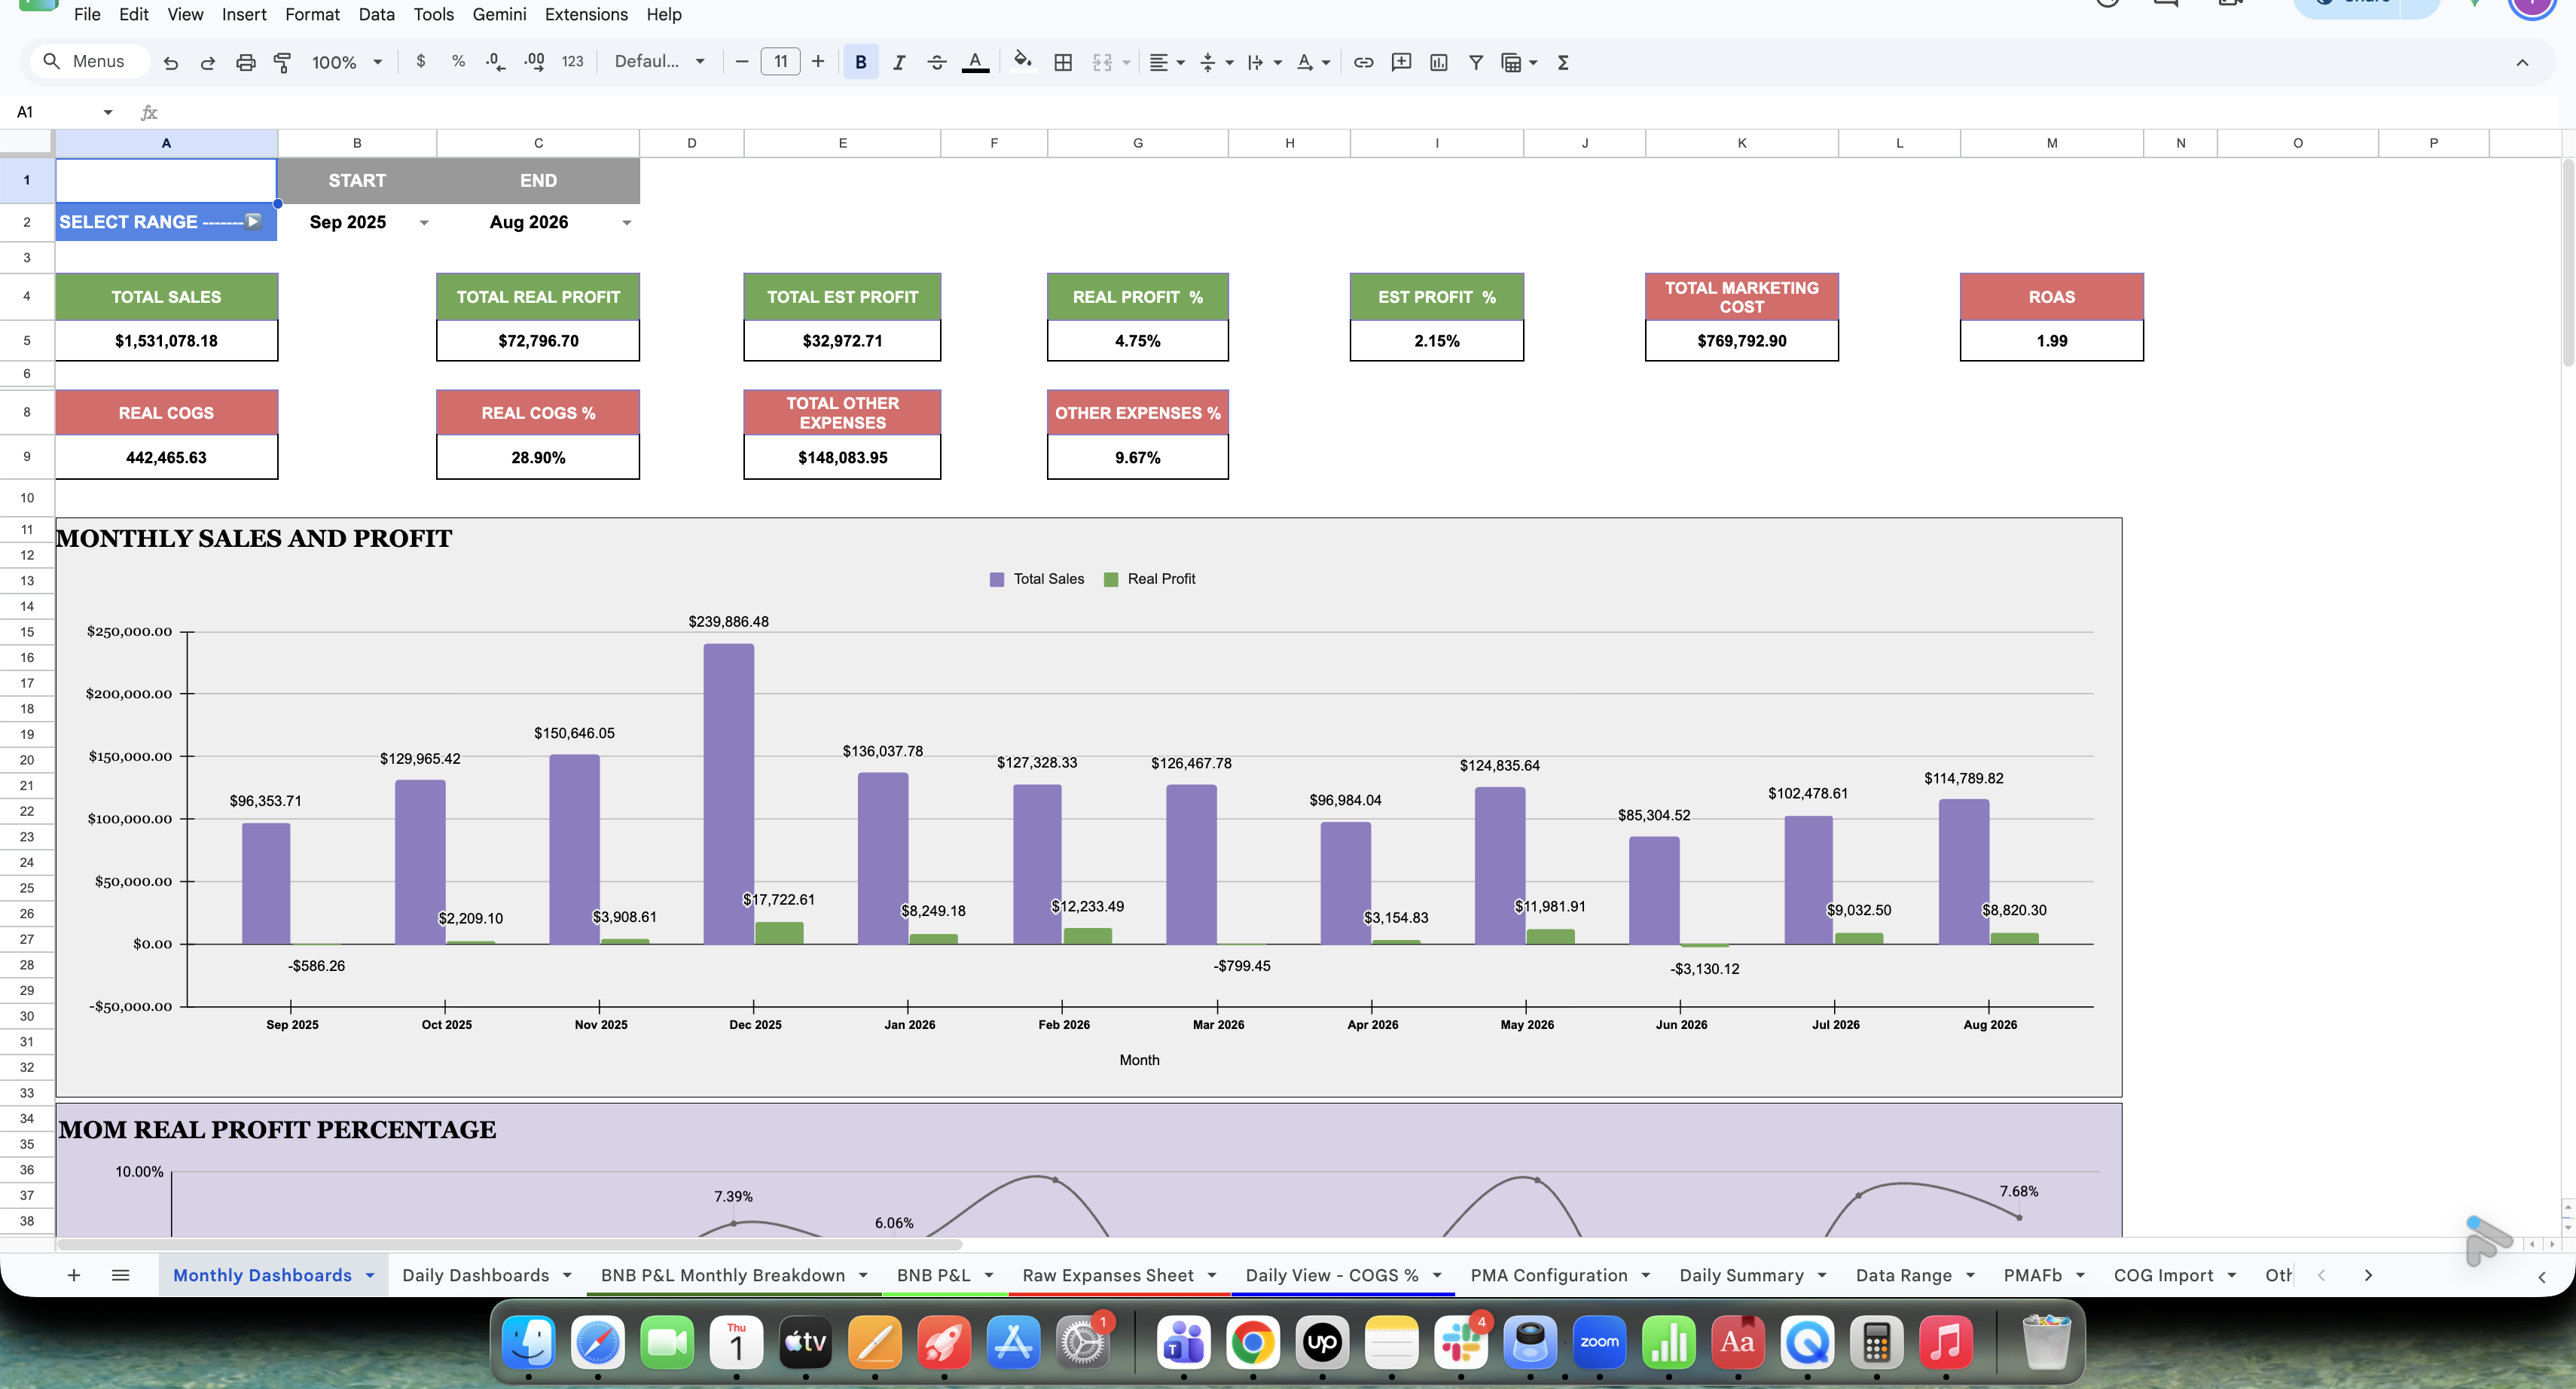
An automated profit & loss tracker built in Google Sheets for an ecommerce business. Pulling sales, real COGS, marketing spend and other expenses into one model, it calculates real vs. estimated profit automatically for any date range instead of being rebuilt by hand every month.
Daily and 30-day views
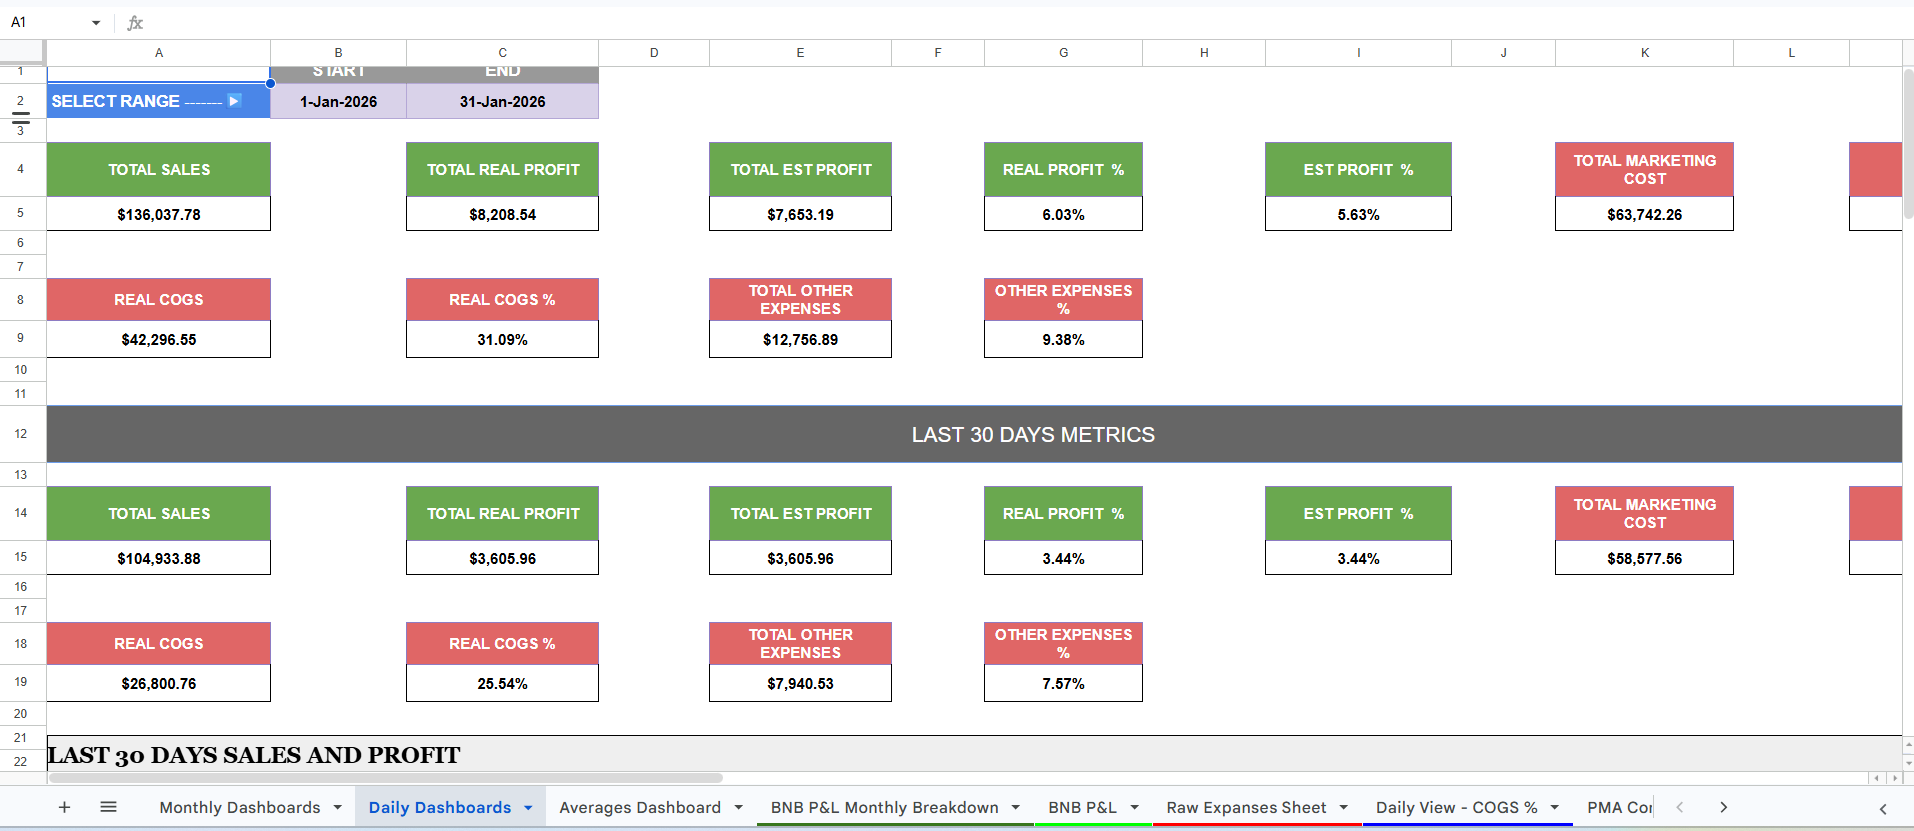
A daily dashboard view surfaces total and trailing-30-day sales, profit and expense metrics side by side, so the team can catch a bad week before it becomes a bad month.
Rolling breakdowns
A rolling 12-month view breaks total profit down into COGS, marketing cost, other expenses and disputes won, so the team can see exactly where margin is being gained or lost.
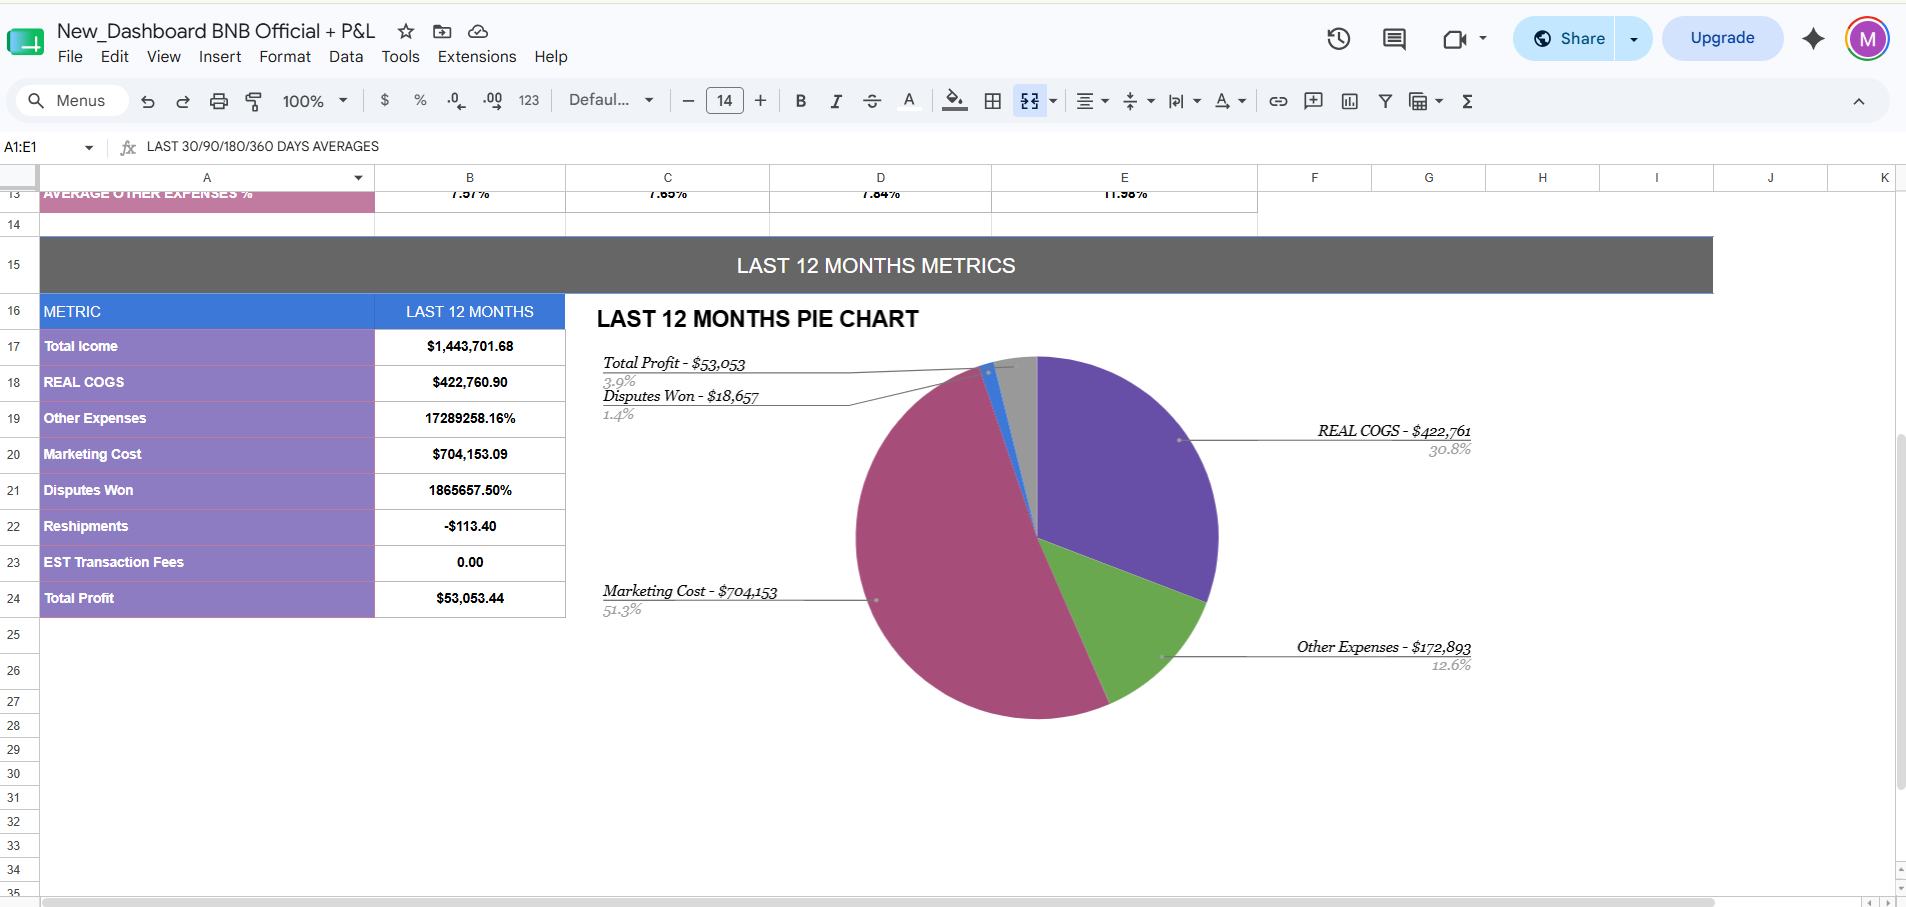
Built as a single Google Sheets template so finance reads live profit numbers for any date range without exporting from five different tools first.
Workflow
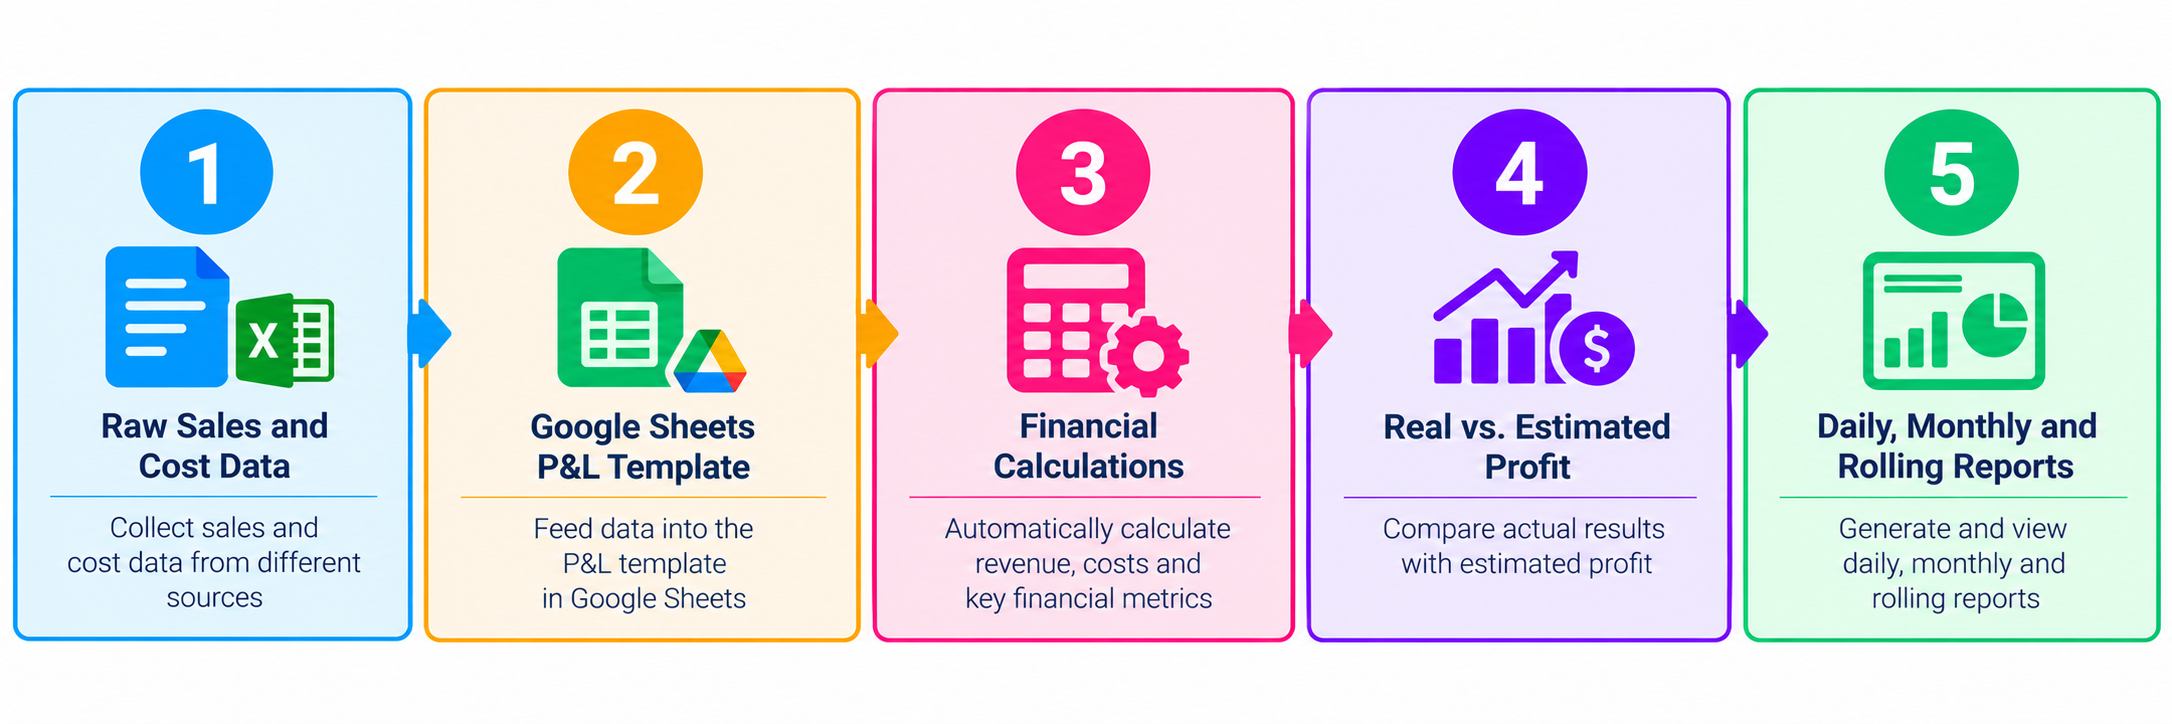
The workflow consolidates the available financial inputs, calculates the relevant profit and margin metrics, and presents the results through reporting views for different periods.
Technology Used
Google Sheets is the core platform used to organize the financial data, calculate P&L metrics, and display the dashboards.
The solution uses a reusable spreadsheet structure to support financial reporting across date ranges and brands.
Results and Business Value
The tracker brings key ecommerce financial metrics into one place and reduces the need to rebuild reports manually.
- Centralized financial visibility: Sales, profit, margins, COGS, and marketing costs can be reviewed together.
- Reduced manual reporting: Calculations and dashboard views are organized within a reusable template.
- Flexible analysis: The team can review performance across daily, monthly, and rolling periods.
- Consistent reporting: Different brands can use the same reporting structure.
- Improved financial oversight: Real and estimated profit figures help the team review financial performance.
Final Outcome
The Automated P&L & Sales Tracker provides an organized, reusable Google Sheets solution for ecommerce financial reporting. By bringing sales, costs, and profitability metrics into one place, it makes financial performance easier to review across selected date ranges and supports more consistent reporting for ecommerce operations.